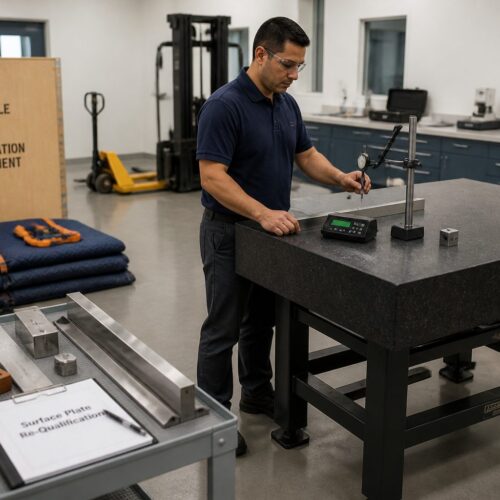
Precision measurement relies heavily on the foundational stability of a surface plate. These granite calibration standards provide an unyielding reference plane for countless industrial applications. Understanding how measurement points are chosen on this critical tool is absolutely essential for anyone serious about accuracy.
The method for selecting these points, often referred to as the surface plate grid layout, dictates the quality and reliability of all subsequent measurements. A well-considered grid ensures that you capture a true representation of the plate’s flatness. Without a proper system, you risk missing critical deviations that could compromise your work.
This layout is not arbitrary; it follows established metrology principles designed to reveal the full character of the surface. We will explore the details of these layouts and why each decision in their design matters for precision. Achieving consistent, verifiable results starts with a robust approach to your surface plate grid layout.
What a Grid Layout Does for Flatness Evaluation
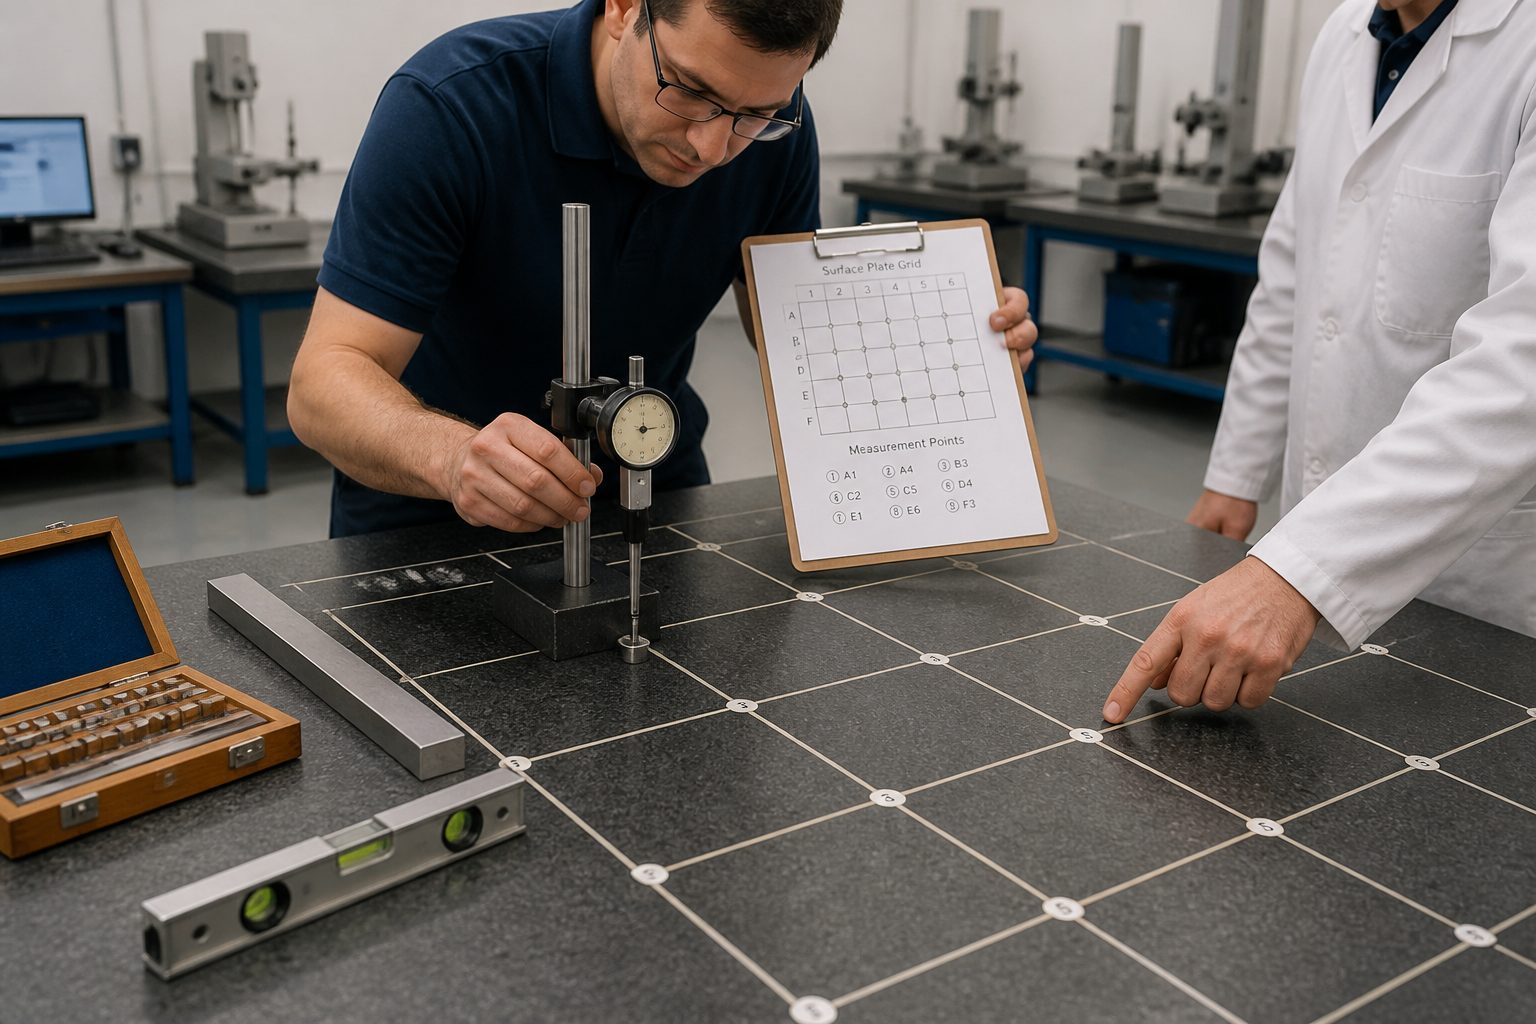
A well-defined surface plate grid layout creates a structured framework for data collection across the entire working surface. This systematic approach ensures that no significant area of the plate is left unchecked during calibration. It provides a comprehensive snapshot of the plate’s topography.
This measurement grid transforms what might be an overwhelming task into a manageable series of discrete points. Each point contributes to a larger picture, revealing subtle variations in elevation. Without this organized approach, reliable flatness mapping would be impossible.
The grid allows technicians to identify high and low spots, known as hills and valleys, across the plate’s surface. These deviations from perfect flatness are critical indicators of the plate’s condition. Understanding these features helps determine if the plate meets its specified tolerance.
By comparing the relative heights of adjacent points, a precise profile of the surface can be generated. This profile forms the basis for flatness mapping, providing a visual and numerical representation of the plate’s accuracy. The surface plate grid layout is the backbone of this analytical process.
The data gathered from the measurement grid is then used to calculate the overall flatness deviation. This final value directly reflects the plate’s suitability for high-precision tasks. A robust grid layout instills confidence in the reported flatness results.
It also helps to detect localized errors that might otherwise go unnoticed with a sparse set of random points. These localized issues can severely impact the accuracy of parts measured on that specific area. A thorough grid pattern helps prevent such oversights.
Ultimately, the effectiveness of any surface plate calibration hinges on the quality and density of its surface plate grid layout. This structured approach is fundamental to maintaining the integrity of all metrology operations. It assures users that their granite calibration standards are performing as expected.
Common Grid Patterns Used in Calibration
Various grid patterns are employed for calibrating surface plates, each designed to optimize the data collection process for specific needs. The choice of pattern often depends on the plate’s size, its intended use, and the required level of measurement precision. A standard surface plate grid layout typically involves either square or rectangular arrangements of points.
These geometric patterns ensure uniform coverage, making it easier to compare readings across the entire surface. Some specialized applications might call for a radial or diagonal measurement grid to capture specific characteristics. However, the most common patterns provide a solid foundation for general flatness mapping.
| Grid Pattern Type | Description | Primary Application |
|---|---|---|
| Standard Square Grid | Points arranged in equally spaced rows and columns. | General purpose flatness mapping, common for most plates. |
| Rectangular Grid | Points in rows and columns, but with different spacing in X and Y axes. | Longer plates, or when checking specific linear features. |
| Diagonal Grid | Points measured along diagonals in addition to perimeter and center lines. | Detecting twist and saddle conditions more effectively. |
| “W” or “M” Pattern | Specific paths followed to link points, often starting at corners. | Efficient for smaller plates, quick overall flatness checks. |
| Dense Perimeter Grid | Increased point density around the edges and corners of the plate. | Identifying edge fall-off, crucial for precise boundary measurements. |
How Plate Size Influences Point Spacing
The physical dimensions of a surface plate directly dictate the appropriate point spacing within its measurement grid. A larger surface plate naturally requires a greater number of measurement points to achieve a representative flatness mapping. This ensures that no significant area goes unexamined.
Smaller plates, such as those measuring 12×18 inches, might use a relatively coarse surface plate grid layout with fewer points. However, a massive 48×72 inch plate demands a much denser grid to properly characterize its entire surface. The goal is always to balance thoroughness with practical calibration time.
Industry standards, like Federal Specification GGG-P-463c or ISO 8512-2, often provide guidelines for minimum point spacing based on plate size. These specifications help ensure consistency and reliability across different calibration labs. Adhering to these guidelines is a mark of professional practice.
Ignoring these recommendations can lead to a sparse measurement grid that misses critical flatness deviations. A grid with too few points might show a plate as flat, even if significant undulations exist between the measured spots. This creates a false sense of security regarding the plate’s accuracy.
The chosen point spacing must be fine enough to capture the expected wavelength of potential errors on a given plate. If a plate is prone to long, gradual bows, a slightly wider spacing might suffice. However, if localized wear is common, a tighter grid is necessary.
Ultimately, the effectiveness of the surface plate grid layout is directly tied to how well its point spacing reflects the plate’s size and expected characteristics. This careful consideration ensures that the flatness evaluation is both accurate and comprehensive. It’s a fundamental aspect of reliable metrology.
Proper point spacing helps reveal the true condition of the granite calibration standards. It contributes significantly to the overall confidence in the measurement results obtained from the plate. Without this thoughtful design, the utility of the surface plate diminishes considerably.
Edge Zones vs Center Zones: Where Errors Hide
Flatness errors on a surface plate rarely distribute themselves uniformly across the entire surface. Instead, they often concentrate in specific areas, with edge zones and corner regions being particularly susceptible to different types of deviations. These areas require special attention within any measurement grid.
Edge fall-off, for instance, is a common phenomenon where the outer perimeter of the plate sags or rises slightly. This can happen due to manufacturing processes, wear patterns, or even the plate’s mounting. A standard surface plate grid layout must account for these potential issues.
The center zone of a surface plate typically experiences different stress patterns and wear characteristics. It might develop a slight dish or crown over time, especially if heavy workpieces are frequently placed there. The measurement grid must be dense enough to accurately map these central contours.
Because of these varying error tendencies, a well-designed surface plate grid layout often incorporates denser point spacing in the edge and corner zones. This increased density provides a more detailed flatness mapping of these critical regions. It helps detect subtle but significant deviations.
Ignoring the specific characteristics of edge versus center zones can lead to misleading flatness evaluations. A calibration based on a uniform, sparse grid might overlook a severe edge fall-off or a significant central depression. This could result in inaccurate measurements for parts placed in those areas.
Experienced metrologists understand that errors love to hide in these less obvious areas, particularly near the very perimeter. They know that a comprehensive measurement grid must prioritize capturing data where problems are most likely to occur. This strategic approach safeguards measurement integrity.
Ensuring adequate point spacing in these critical zones is a hallmark of a robust calibration process. It directly contributes to the reliability of the granite calibration standards. This nuanced approach to the surface plate grid layout is indispensable for high-precision work.
Practical Reasons to Use More or Fewer Points
The decision to use a higher or lower density of measurement points in a surface plate grid layout involves a balance of accuracy requirements, available resources, and practical considerations. While more points generally lead to a more comprehensive flatness mapping, diminishing returns and increased costs often come into play. A denser measurement grid provides a finer resolution of the surface topography.
This detailed information is invaluable for critical applications demanding the highest precision, such as aerospace or semiconductor manufacturing. However, collecting data from hundreds or thousands of points significantly increases calibration time and expense. This trade-off requires careful consideration based on the plate’s intended use and the tolerance required.
- Achieving highest possible accuracy
- Detecting subtle, localized defects
- Complying with strict industry standards
- Tracking long-term wear patterns precisely
- Performing initial plate certification
- Reducing calibration time and cost
- Monitoring general plate condition
- Conducting routine in-house checks
- When plate tolerance is less stringent
- For smaller plates with uniform wear
How a Grid Supports Reconditioning Decisions
The data derived from a consistent surface plate grid layout provides invaluable insights for making informed reconditioning decisions. When a surface plate falls out of tolerance, the flatness mapping generated from the grid points precisely pinpoints the areas needing attention. This detailed information guides technicians in the re-lapping process.
Without this objective data, reconditioning would be a much more subjective and potentially less effective process. The measurement grid shows exactly where material needs to be removed or where the plate has worn down. This targeted approach saves time and ensures the plate is returned to its optimal flatness specification.
Over time, repeated flatness mapping using the same surface plate grid layout creates a historical record of the plate’s wear patterns. This trend data helps predict when reconditioning might be necessary, allowing for proactive maintenance scheduling. Such foresight minimizes downtime and maximizes the plate’s operational life.
The grid data provides concrete evidence for justifying the expense of reconditioning. It demonstrates that the plate’s performance has degraded beyond acceptable limits, necessitating corrective action. This transparency is important for quality control and budgeting.
Furthermore, the grid helps evaluate the success of the reconditioning process itself. A post-reconditioning flatness mapping can be directly compared to previous data to verify that the plate now meets its required tolerance. This verification step confirms the quality of the work performed.
Understanding the specific areas of wear, such as a central dish or edge fall-off, allows technicians to employ the most effective re-lapping techniques. This precise knowledge prevents over-grinding areas that are still within tolerance. It ensures a more efficient and less destructive reconditioning.
Ultimately, the surface plate grid layout transforms reconditioning from a reactive repair into a data-driven maintenance strategy. It protects the investment in granite calibration standards by ensuring they can be restored to their original precision. This systematic approach is a cornerstone of responsible metrology practice.
Reading a Flatness Map Without Getting Lost
A flatness map is a visual representation of the data collected from a surface plate grid layout, translating numerical deviations into an easily interpretable graphical format. Understanding how to read these maps is crucial for anyone relying on the accuracy of a surface plate. These maps typically use contour lines or color gradients to illustrate variations in height.
Contour lines connect points of equal elevation, much like a topographical map, with closer lines indicating steeper changes in flatness. Color gradients, on the other hand, use a spectrum of colors to represent different height ranges, often with green for nominal flatness, and reds or blues for high or low spots. Both methods provide a clear visual of the measurement grid’s findings.
The map will usually include a legend that defines the contour interval or the specific height range each color represents. Paying close attention to this legend is fundamental for correctly interpreting the magnitude of the deviations. Without it, you are simply looking at a pattern without understanding its significance.
Identifying the highest and lowest points on the map is a primary step in understanding the plate’s overall condition. These extreme points define the total flatness deviation, which is the critical value for determining if the plate meets its specified tolerance. The measurement grid data directly informs these values.
Look for patterns such as a general “bow” or “dish” across the plate, indicated by concentric contours or a large central color change. Also, inspect for localized “hills” or “valleys,” which show up as tighter, more isolated contour groups or small, distinct color patches. These patterns reveal specific wear or manufacturing characteristics derived from the surface plate grid layout.
The map also helps visualize the relationship between different areas of the plate, showing how deviations in one section might influence another. This holistic view is invaluable for understanding the plate’s overall geometry. It moves beyond individual point readings to a comprehensive understanding of the surface.
Ultimately, mastering the interpretation of a flatness map allows you to make informed decisions about the use and maintenance of your granite calibration standards. It transforms raw measurement grid data into actionable intelligence. This skill empowers you to confidently assess the integrity of your measuring foundation.
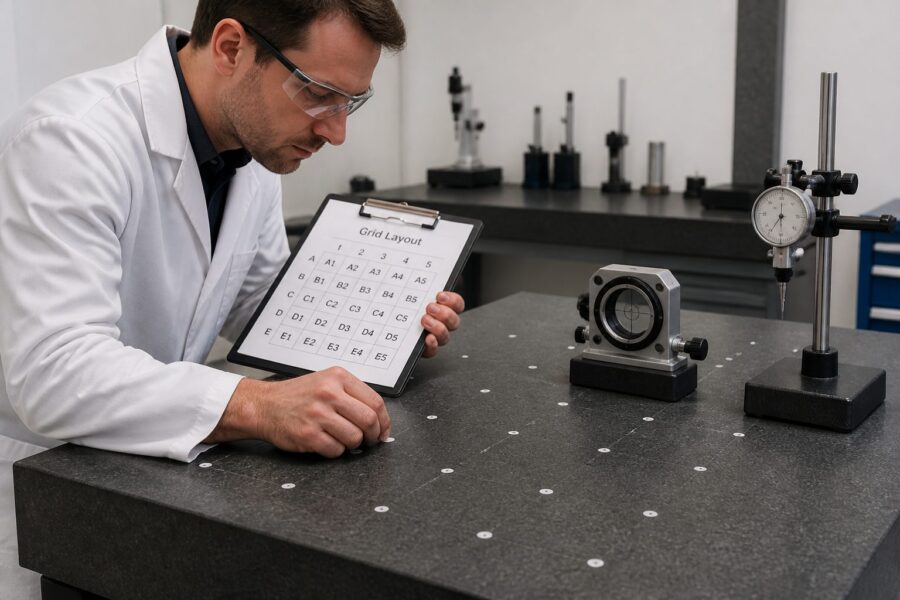
Marking and Protecting Reference Points on the Plate
Establishing and maintaining physical reference points for the surface plate grid layout is essential for repeatable and reliable calibrations. These marks guide the precise placement of measuring instruments, ensuring that each subsequent measurement is taken from the exact same location. Consistent probe placement is a cornerstone of accurate flatness mapping.
Various methods exist for marking these points, ranging from temporary solutions to more permanent ones. Temporary marks might involve a fine-tip marker or a grease pencil, which can be easily removed without damaging the granite. For long-term use, small, shallow indentations or etched crosshairs are sometimes employed, though these require careful execution to avoid compromising the plate’s integrity.
The key is to select a marking method that is visible, durable enough for the calibration period, and non-damaging to the precision surface. The marks should be clear enough for the operator to quickly and accurately align their probe. This reduces the chance of human error during data collection from the measurement grid.
Protecting these reference points is just as important as marking them correctly. Avoiding abrasion, chemical exposure, or impact to the marked areas helps preserve their clarity and accuracy. Operators should use extreme care when cleaning the plate to ensure the marks remain intact.
Some facilities use transparent overlays or templates with pre-drilled holes that align with the surface plate grid layout. These tools eliminate the need for direct marking on the granite surface, offering an excellent way to protect the plate while ensuring precise probe positioning. They provide a physical guide without permanent alteration.
Regularly inspecting the marked points for wear or fading is also a good practice. Faint or damaged marks can lead to inconsistent probe placement, which in turn degrades the reliability of the flatness mapping. Maintaining clear reference points directly contributes to data integrity.
Ultimately, the diligence applied to marking and protecting the surface plate grid layout points reflects a commitment to precision metrology. This attention to detail ensures that the granite calibration standards consistently provide accurate and verifiable data. It is a small but significant factor in overall measurement quality.
Using the Grid for Your Own Spot Checks
While professional calibration remains essential, you can leverage the existing surface plate grid layout for your own in-house spot checks between official certifications. These interim checks help monitor the plate’s condition, giving you early warning of potential issues before they impact production. Implementing a simplified measurement grid for these checks can provide valuable insights.
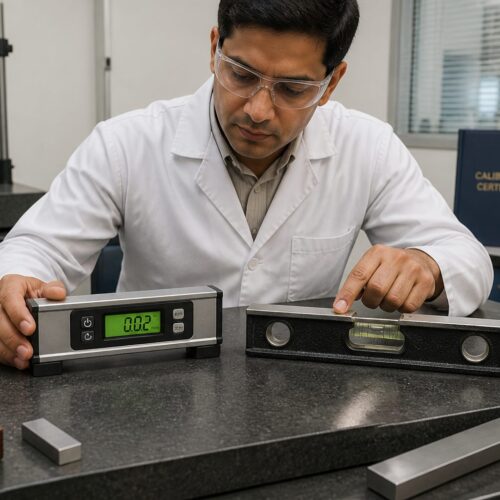
You can focus on critical areas of the plate, such as the most frequently used sections or corners known to be prone to wear. Using a dial indicator mounted on a precision straightedge or an electronic level, you can quickly assess relative height differences between adjacent grid points. This proactive monitoring helps maintain accuracy.
Select a subset of points from the established surface plate grid layout that are easy to access and representative of the plate’s overall condition. For example, checking the four corners and the center point can provide a quick, general assessment of stability. This targeted approach is efficient and effective for routine monitoring.
Record your readings over time to establish a baseline and track any noticeable changes. Even small shifts can indicate developing wear or environmental influences affecting the plate’s flatness. Consistent documentation is key to identifying trends.
These spot checks are not a substitute for comprehensive professional calibration and flatness mapping, but they serve as an excellent early detection system. They allow you to identify significant deviations that might warrant an unscheduled re-calibration. This vigilance protects your precision work.
Performing these checks also helps familiarize your team with the surface plate’s characteristics and the principles of flatness measurement. This hands-on experience builds a deeper understanding of metrology. It empowers your staff to be more attentive to measurement integrity.
Regular spot checks, guided by the established surface plate grid layout, extend the useful life of your granite calibration standards. They ensure that you are always working on a foundation you trust. This simple practice contributes significantly to overall quality control within your facility.
Mistakes That Make Grid Data Less Reliable
Even the most meticulously designed surface plate grid layout can yield unreliable data if common calibration mistakes are not avoided. Inconsistent probe pressure is a frequent culprit, where varying force applied to the indicator causes false readings at each measurement grid point. Maintaining uniform pressure is fundamental for accurate data collection.
Environmental fluctuations, such as significant temperature changes or vibrations, can also severely distort flatness mapping results. Granite expands and contracts with temperature, so the plate must be thermally stable before and during calibration. Performing measurements in a controlled environment is not merely a suggestion, it is a requirement.
A dirty surface plate is another common error source; even microscopic dust particles or debris can create artificial high spots. Thoroughly cleaning the plate with appropriate solutions and lint-free cloths before calibration is absolutely essential. A pristine surface ensures that you are measuring the granite, not contaminants.
Deviating from the established surface plate grid layout, whether by skipping points or measuring outside the designated marks, introduces inconsistencies that invalidate the data. Every point has a specific purpose within the grid, and straying from it compromises the entire flatness mapping. Strict adherence to the pattern is non-negotiable.
Operator error, including improper reading of instruments or incorrect data entry, can also lead to skewed results. Thorough training and careful attention to detail are paramount for anyone performing surface plate calibration. Human vigilance complements technical precision.
Furthermore, using uncalibrated or improperly functioning measuring equipment (like an inaccurate auto-collimator or level) will naturally produce faulty data. All instruments used in the flatness mapping process must themselves be regularly calibrated and verified. The integrity of your tools directly impacts the integrity of your results.
Poor lighting can also hinder an operator’s ability to precisely align the measuring probe with the marked grid points. Adequate, consistent lighting helps prevent parallax errors and ensures accurate placement. Overlooking seemingly minor factors like these can have a major impact on reliability.
Conclusion
The thoughtful design and meticulous execution of a surface plate grid layout are not merely technical details; they are fundamental pillars of precision metrology. This structured approach to selecting measurement points ensures that every flatness evaluation is comprehensive, accurate, and reliable. It forms the bedrock upon which all subsequent measurements are built.
Understanding the nuances of point spacing, recognizing where errors typically hide, and knowing how to interpret a flatness map are skills that empower metrologists. These insights allow for informed decisions regarding plate usage, maintenance, and reconditioning. The surface plate grid layout is truly a critical tool in maintaining the highest standards of quality control.
Embracing these principles ensures that your granite calibration standards consistently provide the stable, accurate reference plane necessary for high-precision manufacturing and inspection. Investing in a thorough understanding of this critical process pays dividends in measurement confidence and operational excellence. Your commitment to precision starts with a well-defined grid.